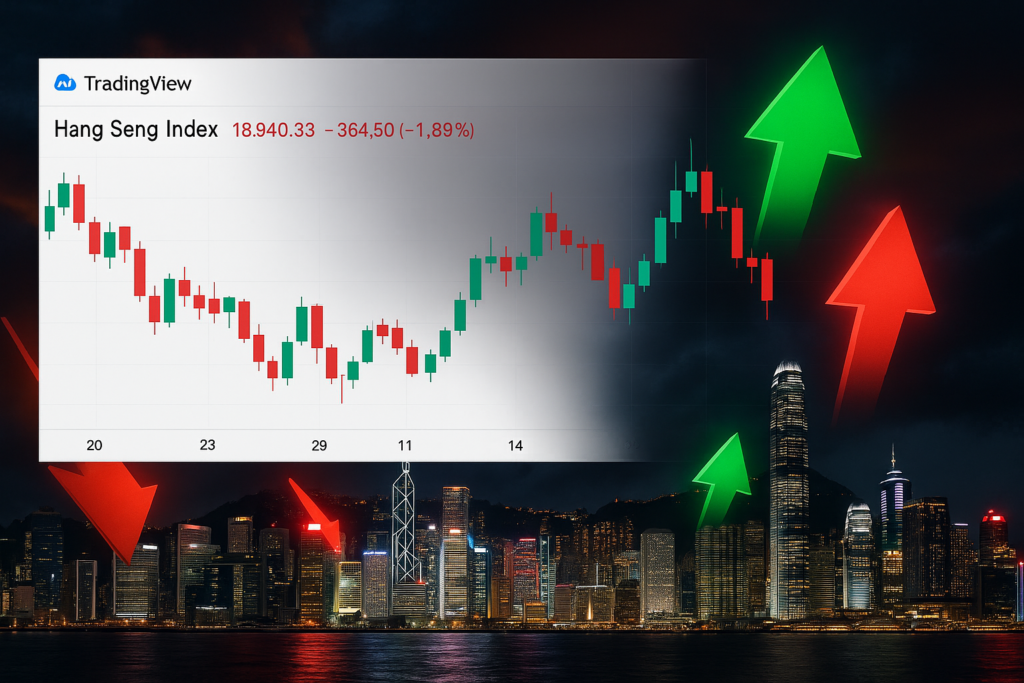
“One look at the chart and your jaw might drop. Is the Hang Seng Index flashing danger — or opportunity?”
The Hang Seng Index (HSI) is making headlines again, and not just for its price action — but for the emotional rollercoaster it’s sending investors on. Whether you’re a seasoned trader or a curious beginner scrolling through TradingView, one thing is clear:
The Hang Seng chart is telling a story. And it’s not boring.
What’s Happening With the Hang Seng Index Right Now?
The HSI has been extremely volatile in recent weeks. We’ve seen:
- Sudden dips below psychological support levels
- Short-term relief rallies fizzling out
- Fear-driven sell-offs triggered by global cues
And yet, the chart isn’t entirely bearish. In fact, depending on how you look at it — this might be the calm before a major bounce.
Why the TradingView Chart Is Grabbing Everyone’s Attention
If you’ve checked the live HSI chart on TradingView, you know it’s not just numbers — it’s drama. Here’s what traders are spotting:
- A possible double bottom forming — a classic bullish reversal sign
- Strong resistance near 19,500, yet repeated attempts to break it
- Oversold RSI levels, hinting at a short-term recovery
- Heavy volume on green candles — showing buyers aren’t done yet
In plain English? This could go either way, and that’s exactly why thousands of eyes are glued to the live chart right now.
Crashing or Bouncing? Here’s What Experts Are Whispering
Market experts are split, but here’s the word on the street:
- Bearish view: Global recession fears, China’s economic slowdown, and real estate stress could push HSI to test 17,000 again.
- Bullish view: Government stimulus, tech recovery, and improved investor sentiment might fuel a comeback rally toward 20,000–21,000 levels.
This is the kind of tension that makes or breaks trading strategies.
Should You Watch, Wait, or Jump In?
That’s the million-dollar question. Here’s a simplified breakdown:
You might watch the chart closely if:
- You’re waiting for a breakout above resistance
- You want to avoid “bull traps” in a volatile market
You might consider short-term plays if:
- You see RSI divergence or bullish patterns on lower timeframes
- You’re experienced with stop-loss strategies and quick exits
You might wait it out completely if:
- You’re unsure about global market direction
- You’re not comfortable with high volatility
Final Thoughts: This Chart Isn’t Just Technical — It’s Emotional
The Hang Seng Index on TradingView right now isn’t just a chart — it’s a psychological battlefield. Bulls and bears are clashing in real-time. Emotions are high. Predictions are wild.
So, is the Hang Seng crashing or bouncing?
Honestly, maybe both — but one thing’s for sure: if you care about Asian markets, this is a chart you need to be watching.
Are you following the Hang Seng Index on TradingView? What patterns are you seeing? Join the conversation below — and share this with a fellow trader who’s been riding the HSI wave lately.
Hang Seng Index Crashing or Bouncing? Live Chart Tells a Shocking Story!